 SpringBoot 基于 Actuator 和 Admin 实现应用监控管理
# 前言
本文将会使用 Spring Boot Actuator 组件实现应用监视和管理,同时结合 Spring Boot Admin 对 Actuator 中的信息进行界面化展示,监控应用的健康状况,提供实时警报功能
# Spring Boot Actuator
# 简介
官方文档:Production-ready Features (spring.io) (opens new window)
Actuator 的核心是端点(Endpoint),它用来监视、提供应用程序的信息,Spring Boot 提供的 spring-boot-actuator 组件中已经内置了非常多的 Endpoint(health、info、beans、metrics、httptrace、shutdown 等),每个端点都可以启用和禁用。Actuator 也允许我们扩展自己的端点。通过 JMX 或 HTTP 的形式暴露自定义端点
注:查看全部 Endpoints 请参照上方的官方文档
Actuator 会将自定义端点的 ID 默认映射到一个带 /actuator 前缀的 URL。比如,health 端点默认映射到 /actuator/health。这样就可以通过 HTTP 的形式获取自定义端点的数据,许多网关作为反向代理需要 URL 来探测后端集群应用是否存活,这个 URL 就可以提供给网关使用
# 启动端点
默认情况下,除shutdown之外的所有终结点都处于启用状态。若要配置终结点的启用,请使用其 management.endpoint.<id>.enabled 属性。以下示例启用终结点 shutdown
management:
  endpoint:
    shutdown:
      enabled: true
2
3
4
如果您希望端点启用选择加入而不是选择退出,请将该 management.endpoints.enabled-by-default 属性设置为 false 并使用单个端点 enabled 属性选择重新加入。以下示例启用该 info 终结点并禁用所有其他终结点:
management:
  endpoints:
    enabled-by-default: false
  endpoint:
    info:
      enabled: true
2
3
4
5
6
注:禁用的端点将从应用程序上下文中完全删除。如果只想更改公开终结点的技术,请改用
include和exclude属性。
# 公开端点
禁用的端点将从应用程序上下文中完全删除。如果只想更改公开终结点的技术,请改用 include 和 exclude 属性。若要更改公开的终结点,请使用以下特定于 include 技术的 exclude 属性
include 属性列出了公开的终结点的 ID。exclude 属性列出了不应公开的终结点的 ID。 exclude 属性优先于该 include 属性。您可以使用端点 ID 列表配置属性和 exclude 属性 include 。
例如,要仅通过 JMX 公开 health 和 info 端点,请使用以下属性
management:
  endpoints:
    jmx:
      exposure:
        include: "health,info"
2
3
4
5
*可用于选择所有端点。例如,若要通过 HTTP 公开除 env 和 beans 终结点之外的所有内容,请使用以下属性
management:
  endpoints:
    web:
      exposure:
        include: "*"
        exclude: "env,beans"
2
3
4
5
6
Actuator 同时还可以与外部应用监控系统整合,比如 Prometheus, Graphite, DataDog, Influx, Wavefront, New Relic 等。这些系统提供了非常好的仪表盘、图标、分析和告警等功能,使得你可以通过统一的接口轻松的监控和管理你的应用系统。这对于实施微服务的中小团队来说,无疑快速高效的解决方案
# 配置集成
首先我们需要创建 springboot web 项目,然后 pom.xml 中添加如下 actuator 依赖
<dependency>
    <groupId>org.springframework.boot</groupId>
    <artifactId>spring-boot-starter-actuator</artifactId>
</dependency>
2
3
4
配置 application.yml
server:
  port: 8080

management:
  endpoints:
    enabled-by-default: false
    web:
      base-path: /manage
      exposure:
        include: 'info,health,env,beans'
  endpoint:
    info:
      enabled: true
    health:
      enabled: true
    env:
      enabled: true
    beans:
      enabled: true
2
3
4
5
6
7
8
9
10
11
12
13
14
15
16
17
18
19
上述配置只暴露 info,health,env,beans 四个 endpoints, web 通过可以 /manage 访问
访问:localhost:8080/manage (opens new window) 查看所有开放的端点
{
    "_links": {
        "self": {
            "href": "http://localhost:8080/manage",
            "templated": false
        },
        "beans": {
            "href": "http://localhost:8080/manage/beans",
            "templated": false
        },
        "health": {
            "href": "http://localhost:8080/manage/health",
            "templated": false
        },
        "health-path": {
            "href": "http://localhost:8080/manage/health/{*path}",
            "templated": true
        },
        "info": {
            "href": "http://localhost:8080/manage/info",
            "templated": false
        },
        "env": {
            "href": "http://localhost:8080/manage/env",
            "templated": false
        },
        "env-toMatch": {
            "href": "http://localhost:8080/manage/env/{toMatch}",
            "templated": true
        }
    }
}
2
3
4
5
6
7
8
9
10
11
12
13
14
15
16
17
18
19
20
21
22
23
24
25
26
27
28
29
30
31
32
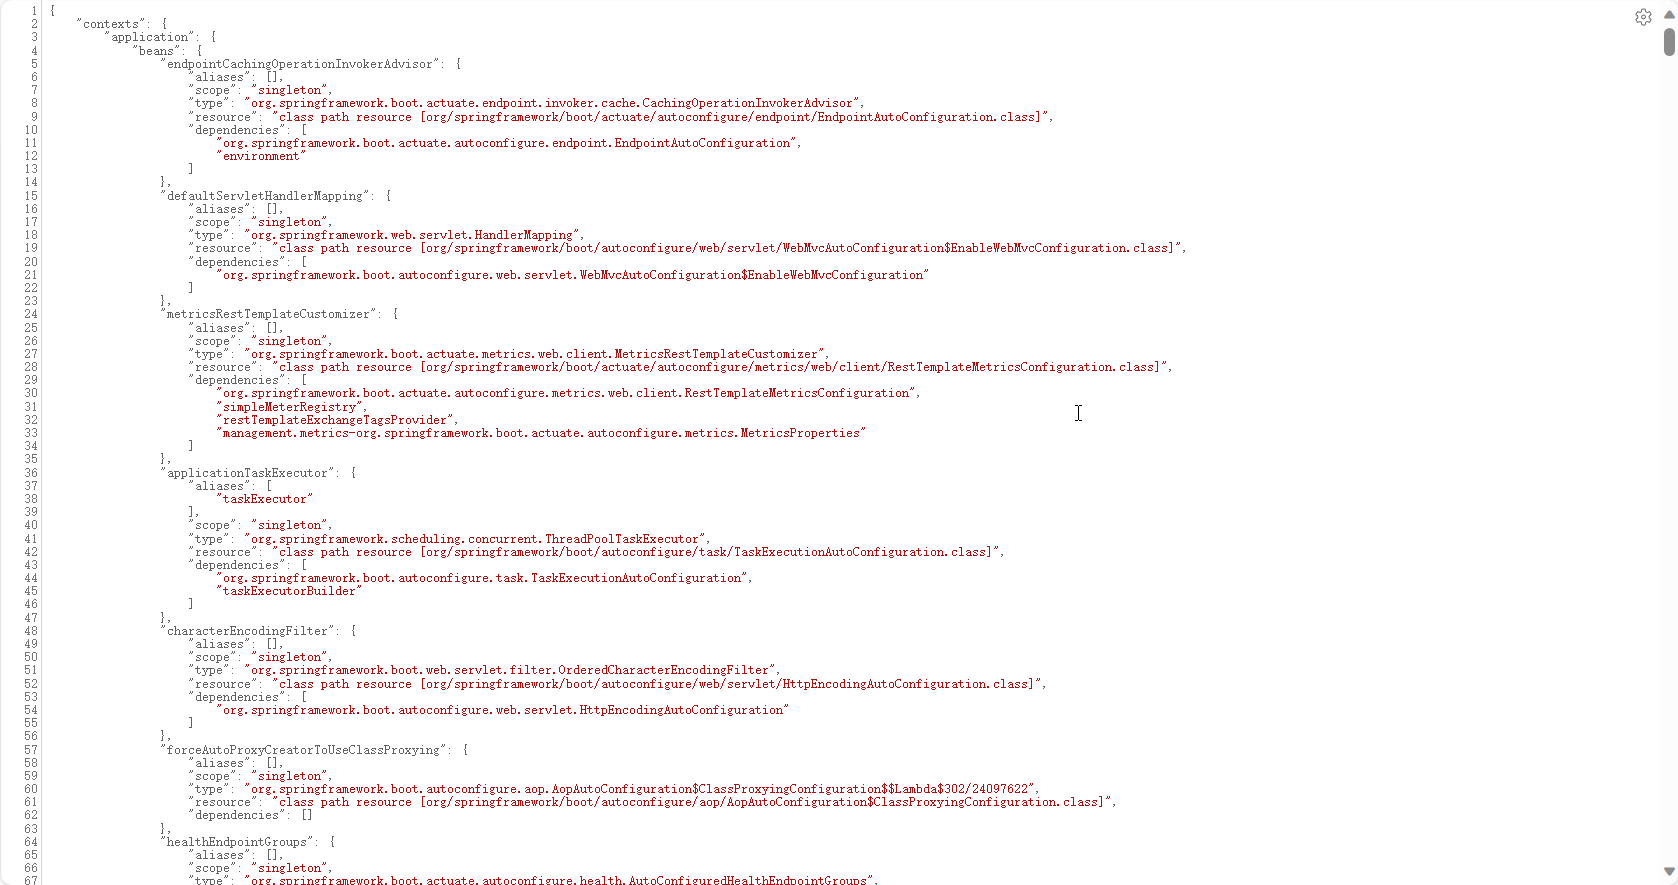
访问:localhost:8080/manage/beans (opens new window)
# 拓展配置
# 安全性
当我们想要暴露更多接口,同时保证 endpoint 接口安全,可以与 Spring Security 集成
@Configuration(proxyBeanMethods = false)
public class MySecurityConfiguration {

    @Bean
    public SecurityFilterChain securityFilterChain(HttpSecurity http) throws Exception {
        http.requestMatcher(EndpointRequest.toAnyEndpoint())
                .authorizeRequests((requests) -> requests.anyRequest().hasRole("ENDPOINT_ADMIN"));
        http.httpBasic();
        return http.build();
    }

}
2
3
4
5
6
7
8
9
10
11
12
此外,如果存在 Spring Security,同时你需要添加自定义安全配置,以允许对端点进行未经身份验证的访问,如以下示例所示
@Configuration(proxyBeanMethods = false)
public class MySecurityConfiguration {

    @Bean
    public SecurityFilterChain securityFilterChain(HttpSecurity http) throws Exception {
        http.securityMatcher(EndpointRequest.toAnyEndpoint());
        http.authorizeHttpRequests((requests) -> requests.anyRequest().permitAll());
        return http.build();
    }

}
2
3
4
5
6
7
8
9
10
11
# 跨域访问
management:
  endpoints:
    web:
      cors:
        allowed-origins: "https://example.com"
        allowed-methods: "GET,POST"
2
3
4
5
6
# 自定义端点
我们可以通过@JmxEndpoint or @WebEndpoint 注解来定义自己的 endpoint, 然后通过@ReadOperation, @WriteOperation 或者@DeleteOperation 来暴露操作
比如添加系统时间 date 的 endpoint
@RestController("custom")
@WebEndpoint(id = "date")
public class CustomEndpointController {

    @ReadOperation
    public ResponseEntity<String> currentDate() {
        return ResponseEntity.ok(LocalDateTime.now().toString());
    }
}
2
3
4
5
6
7
8
9
management:
  endpoints:
    enabled-by-default: false
    web:
      base-path: /manage
      exposure:
        include: 'info,health,env,beans,date'
  endpoint:
    info:
      enabled: true
    health:
      enabled: true
    env:
      enabled: true
    beans:
      enabled: true
    date:
      enabled: true
2
3
4
5
6
7
8
9
10
11
12
13
14
15
16
17
18
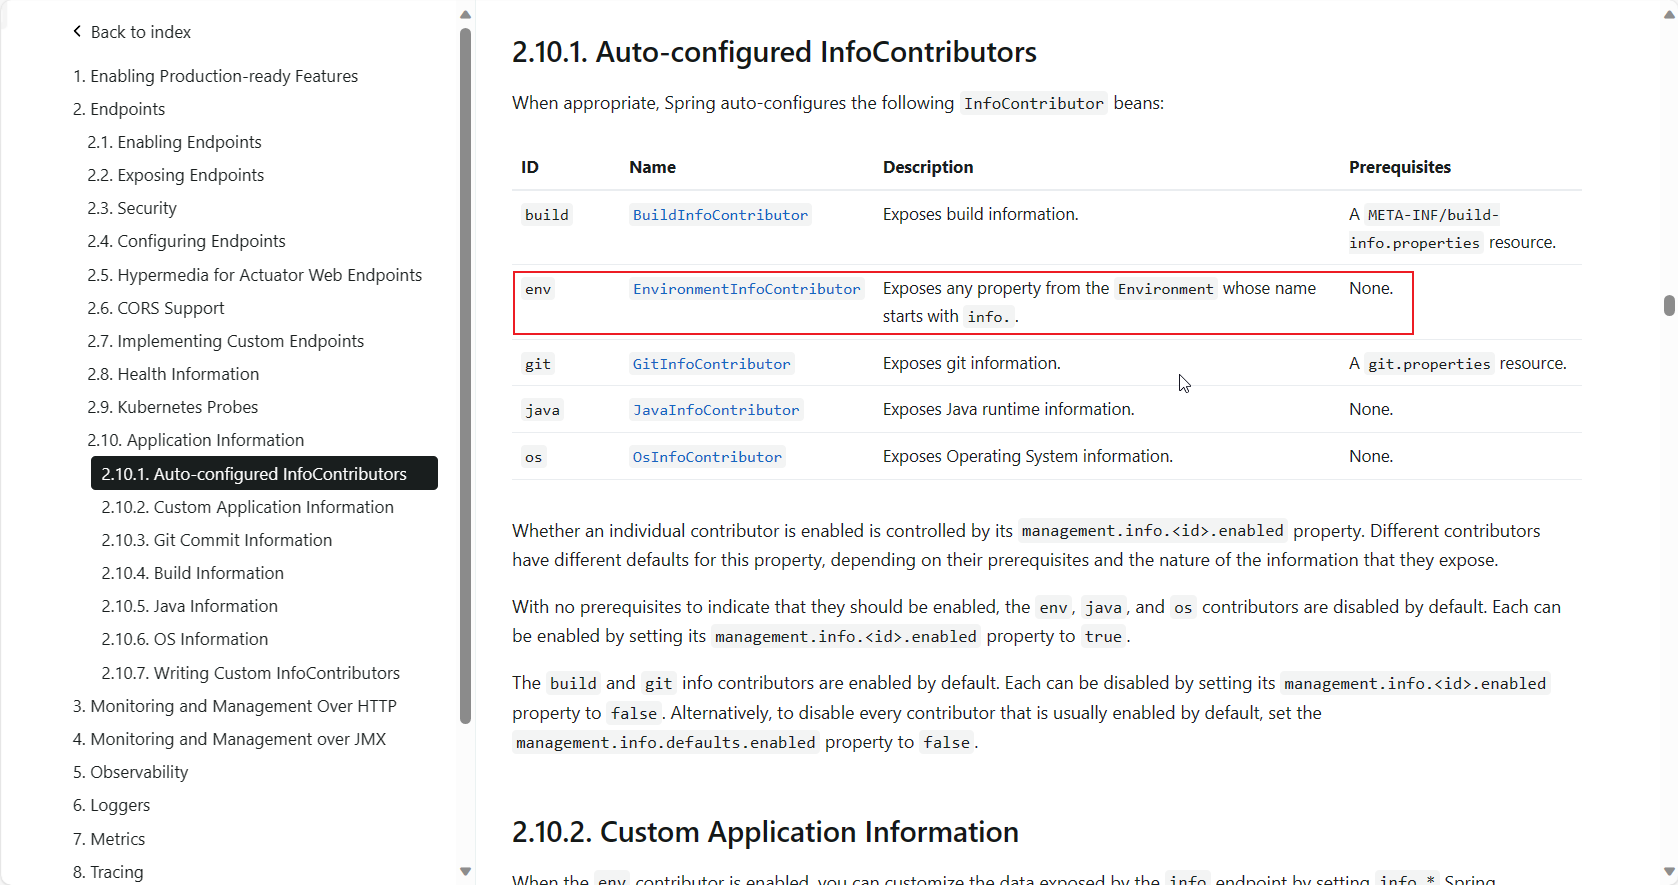
# info 不显示
我们直接访问 info 接口是空的
问题出处官方文档:Production-ready Features (spring.io) (opens new window)
解决方案,修改 application.yml 如下
management:
  endpoint:
    info:
      env:
        enabled: true
2
3
4
5
# Spring Boot Admin
# 简介
官方仓库:codecentric/spring-boot-admin (opens new window)
官方文档:Spring Boot Admin – (spring-boot-admin.com) (opens new window)
Spring Boot Admin(简称 SBA)由两部分组成:SBA Server 和 SBA Client
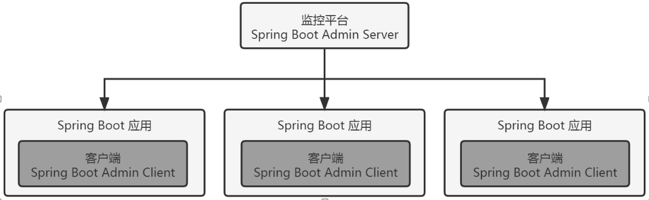
SBA Server: 包括 Admin 用户界面并独立运行于被监控应用
SBA Client: 提供一种方式将被监控应用注册到 SBA Server
SBA 分为服务端和客户端原理:因为 SBA 需要做集中化的监控(比如应用的集群,多个服务或者微服务等),而不是每个应用都需要有一个 UI。同时被监控的应用应该是和监控平台是分离的,并且需要考虑其他语言和其他平台的集成
除此之外,SBA Client 不仅只可以注册到 SBA Server ,还可以注册到 Spring Cloud Discovery(微服务),Python Applications Using Pyctuator(其他语言)等平台
# 启用 Server
pom.xml 配置
<dependency>
    <groupId>de.codecentric</groupId>
    <artifactId>spring-boot-admin-starter-server</artifactId>
    <version>2.5.3</version>
</dependency>
2
3
4
5
注意:这里我们必须添加
<version>字段,因为父模块spring-boot-starter-parent中的 BOM(Bill of Material) 并没有配置 SBA 的 version,无法自动识别
通过 @EnableAdminServer 注解启用 SBA Server
@Configuration
@EnableAdminServer
@SpringBootApplication
public class SpringBootActuatorDemoApplication {

    public static void main(String[] args) {
        SpringApplication.run(SpringBootActuatorDemoApplication.class, args);
    }

}
2
3
4
5
6
7
8
9
10
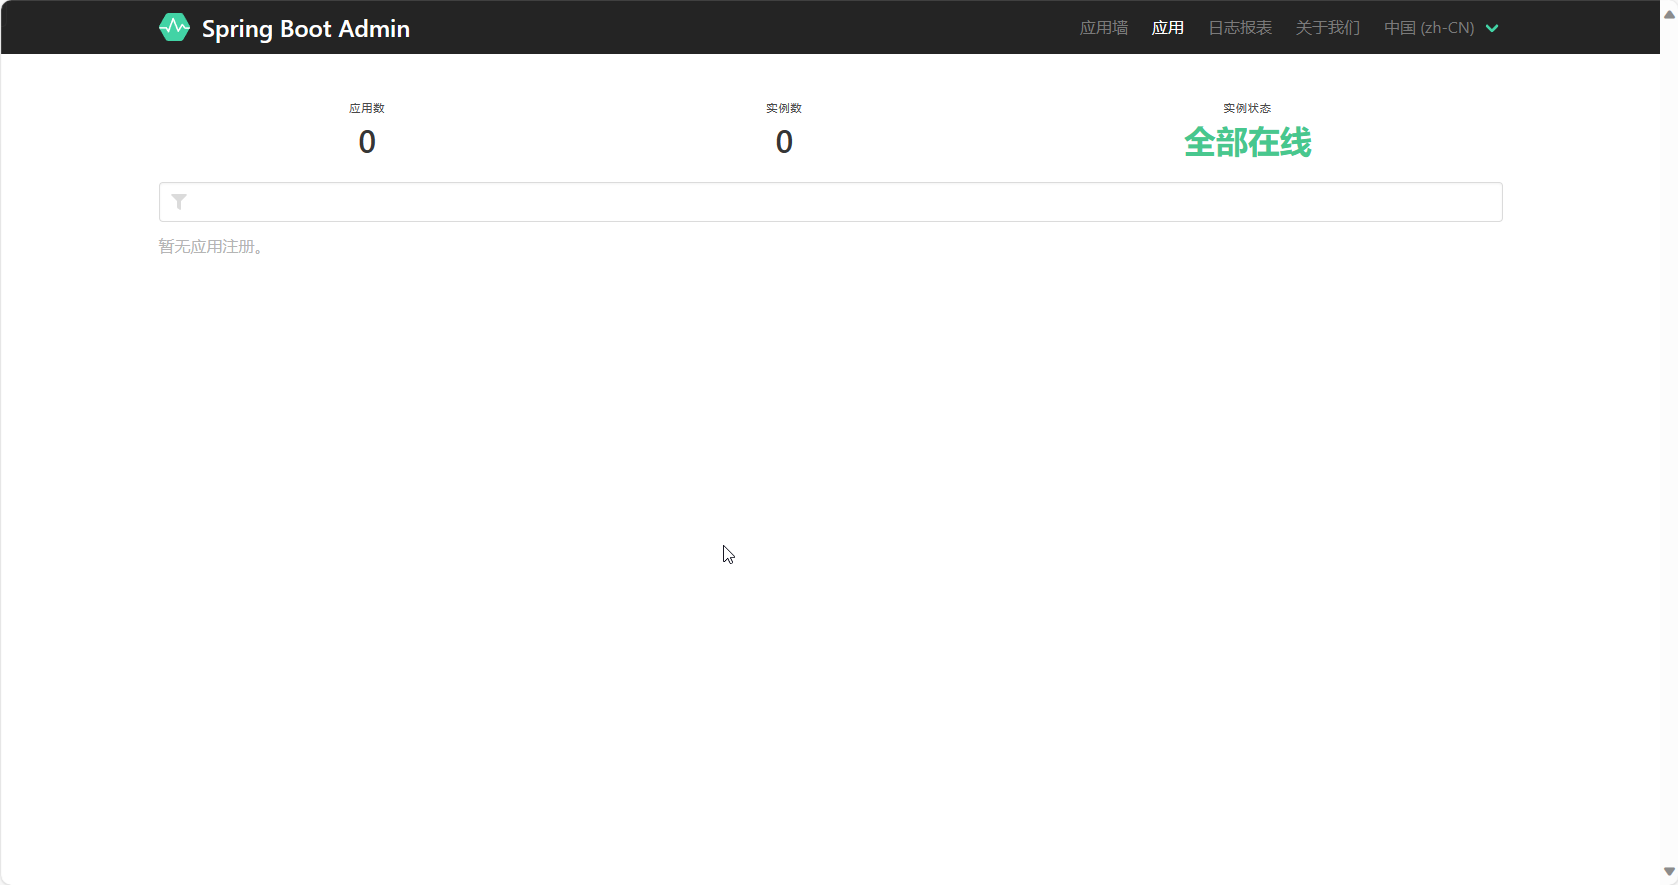
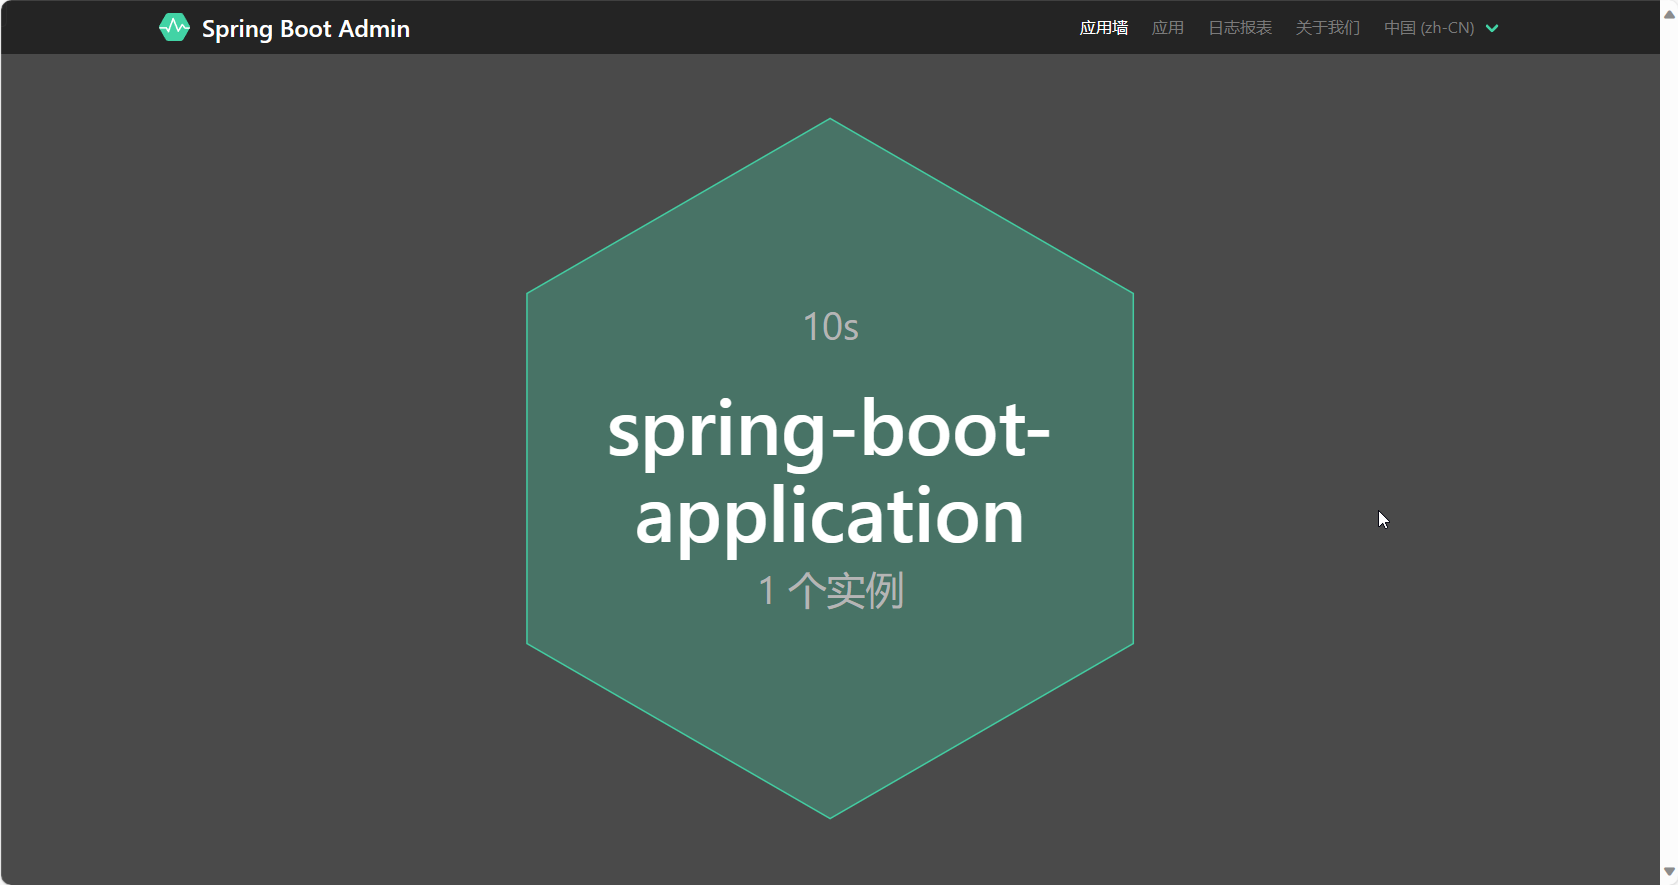
访问:Spring Boot Admin (opens new window)
# 注册 Client
引入 SBA Client 依赖
<dependency>
    <groupId>de.codecentric</groupId>
    <artifactId>spring-boot-admin-starter-client</artifactId>
    <version>2.5.3</version>
</dependency>
2
3
4
5
配置 application.yml
server:
  port: 8080

management:
  endpoints:
    enabled-by-default: false
    web:
      base-path: /manage
      exposure:
        include: 'info,health,env,beans'
  endpoint:
    info:
      env:
        enabled: true
      enabled: true
    health:
      enabled: true
    env:
      enabled: true
    beans:
      enabled: true
# 添加如下配置
spring:
  boot:
    admin:
      client:
        url: 'http://localhost:8080'
2
3
4
5
6
7
8
9
10
11
12
13
14
15
16
17
18
19
20
21
22
23
24
25
26
27
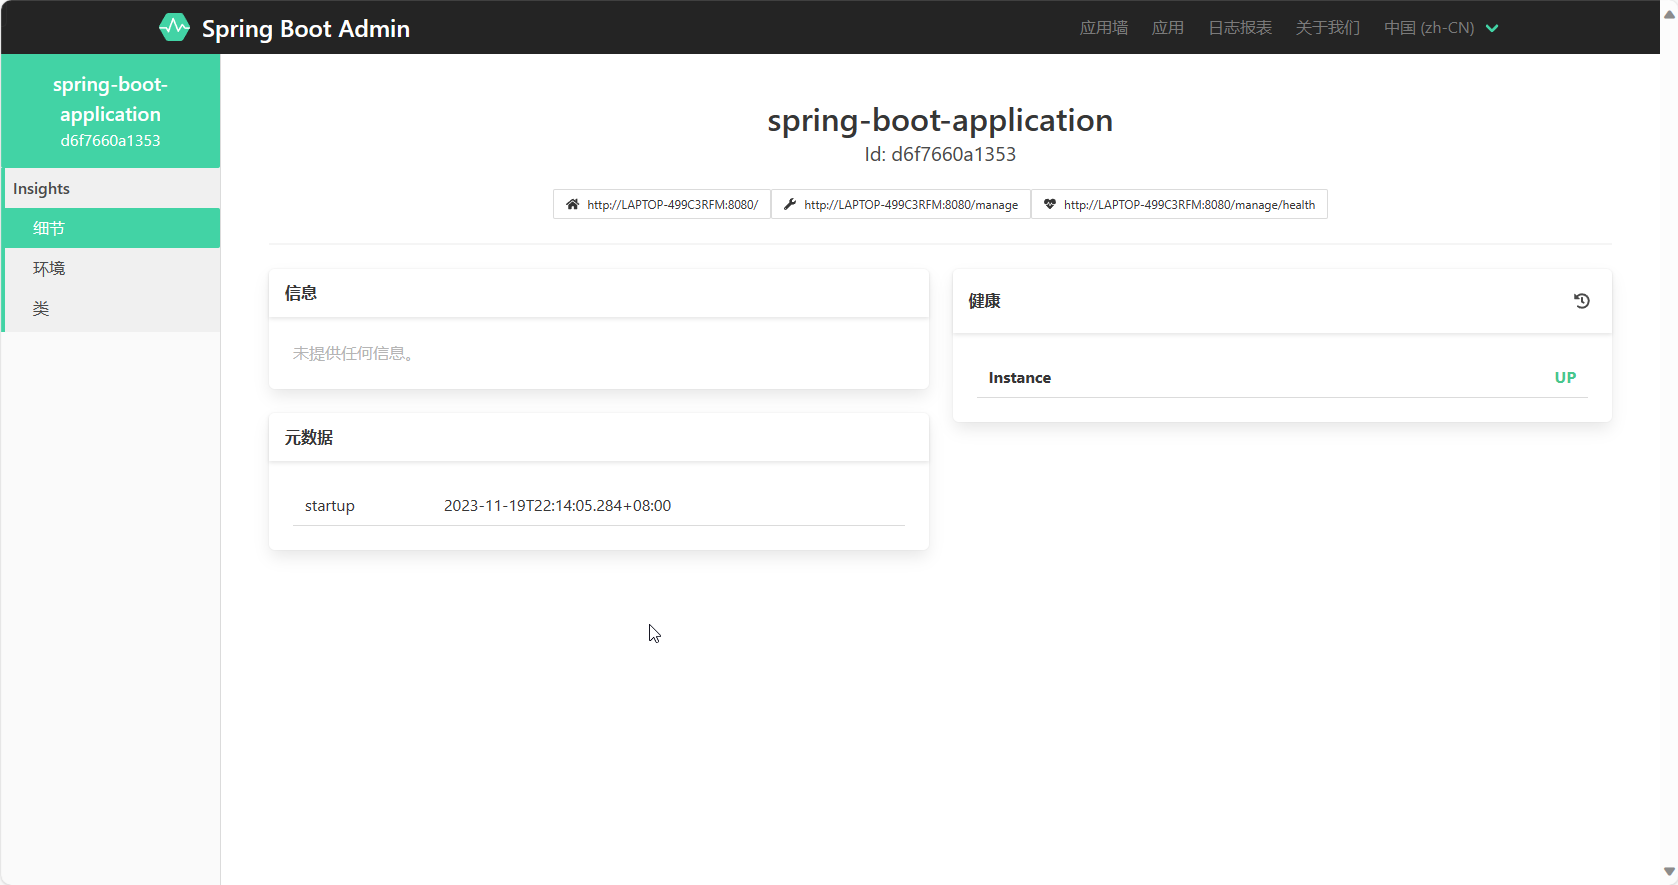
访问:Spring Boot Admin (opens new window)
之后点击进入实例,可以自行探索监控信息
# 其他问题
# 启用 JMX 管理
默认下 SBA 没有启用 JMX,需要通过如下配置启用。
首先需要引入 POM 依赖(PS:需要 SpringBoot2.2+ 版本)
<dependency>
    <groupId>org.jolokia</groupId>
    <artifactId>jolokia-core</artifactId>
</dependency>
2
3
4
yml 配置
spring:
  jmx:
    enabled: true
2
3
# 显示日志内容
默认下没有显示 Log File 的内容,如果需要显示 SpringBoot 应用日志需要进行如下配置(配置 logging.file.path 或者 logging.file.name)
logging:
  file:
    name: 'pdai-spring-boot-application.log'
  pattern:
    file: '%clr(%d{yyyy-MM-dd HH:mm:ss.SSS}){faint} %clr(%5p) %clr(${PID}){magenta} %clr(---){faint} %clr([%15.15t]){faint} %clr(%-40.40logger{39}){cyan} %clr(:){faint} %m%n%wEx'
2
3
4
5
# 继承 Spring Security
<dependency>
    <groupId>org.springframework.boot</groupId>
    <artifactId>spring-boot-starter-security</artifactId>
</dependency>
2
3
4
@Configuration
public static class SecurityPermitAllConfig extends WebSecurityConfigurerAdapter {
    @Override
    protected void configure(HttpSecurity http) throws Exception {
        http.authorizeRequests().anyRequest().permitAll()
            .and().csrf().disable();
    }
}
2
3
4
5
6
7
8
# 通知告警信息
集成 spring-boot-starter-mail 配置 JavaMailSender 来用邮件通知信息
官方文档对应链接:Spring Boot Admin – (spring-boot-admin.com) (opens new window)
<dependency>
    <groupId>org.springframework.boot</groupId>
    <artifactId>spring-boot-starter-mail</artifactId>
</dependency>
2
3
4
spring:
    mail:
        host:smtp.example.com
    boot:
        admin:
            notify:
                mail:
                    to:admin@example.com
2
3
4
5
6
7
8
注:更多通知方式(钉钉,微信等)可以直接参考上方官方文档
# 补充
在生产环境下,使用 Prometheus + Grafana 组合也是非常推荐的监控解决方案,这里篇章有限,读者可以自行探索
# 参考链接
- SpringBoot 监控 - 集成 actuator 监控工具 | Java 全栈知识体系 (pdai.tech) (opens new window)
- SpringBoot 监控 - 集成 springboot admin 监控工具 | Java 全栈知识体系 (pdai.tech) (opens new window)
- 微服务系列:服务监控 Spring Boot Actuator 和 Spring Boot Admin - 掘金 (juejin.cn) (opens new window)
- 实战:使用 Spring Boot Admin 实现运维监控平台-阿里云开发者社区 (aliyun.com) (opens new window)
- Prometheus 快速入门教程(六):Spring Boot Actuator 实现应用监控 (opens new window)
- Prometheus简介 - prometheus-book (gitbook.io) (opens new window)